Quick Start
You can use canopy in two modes:
Interactive mode, an intuitive and flexible mode, that allows you to load and manipulate data, and generate figures using python functions.
JSON mode, a easy-to-use and fast mode, to directly generate figures using a structured JSON configuration file.
In the examples below, the same figure is created via each mode.
Interactive mode
Canopy is shipped with some test data. To see the available test datasets, use list_test_data().
import canopy as cp
cp.list_test_data()
Available test data:
--------------------
aaet_global_sites.out.gz: Annual evapotranspiration for sites on LPJ-GUESS's gridlist_global.txt, 1901-2015 (LPJ-GUESS, CRU-NCEP data).
anpp_spain_1990_2010.out.gz: Annual NPP in Spain, 1990-2010 (LPJ-GUESS, CRU-NCEP data).
anpp_spain_1990_2010_mod.out.gz: Annual NPP in Spain, 1990-2010 (LPJ-GUESS, CRU-NCEP data). With random modifications for testing.
To load one of the test files, the file name is supplied to load_test_data():
anpp = cp.load_test_data('anpp_spain_1990_2010.out.gz')
print(anpp)
Data
----
name: Annual NPP
units: kgC m^-2 year^-1
description: Annual net primary productivity by PFT
file format: LPJ-GUESS: common output (annual)
original file: /home/belda-d/projects/canopy/canopy/tests/test_data/anpp_spain_1990_2010.out.gz

Grid: lonlat
------------
Longitude:
-9.25 to 3.75 (step: 0.5)
Latitude:
35.25 to 43.75 (step: 0.5)

Time series
-----------
Span: 1990-01-01 00:00:00 - 2010-12-31 23:59:59.999999999
Frequency: Y-DEC

History
-------
2025-06-15 16:16:26: Data read from /home/belda-d/projects/canopy/canopy/tests/test_data/anpp_spain_1990_2010.out.gz
Note
To load files other than the packaged test data, see Sec. Reading files.
We can use the make_simple_map() function to make a map:
import canopy.visualization as cv
# Create map
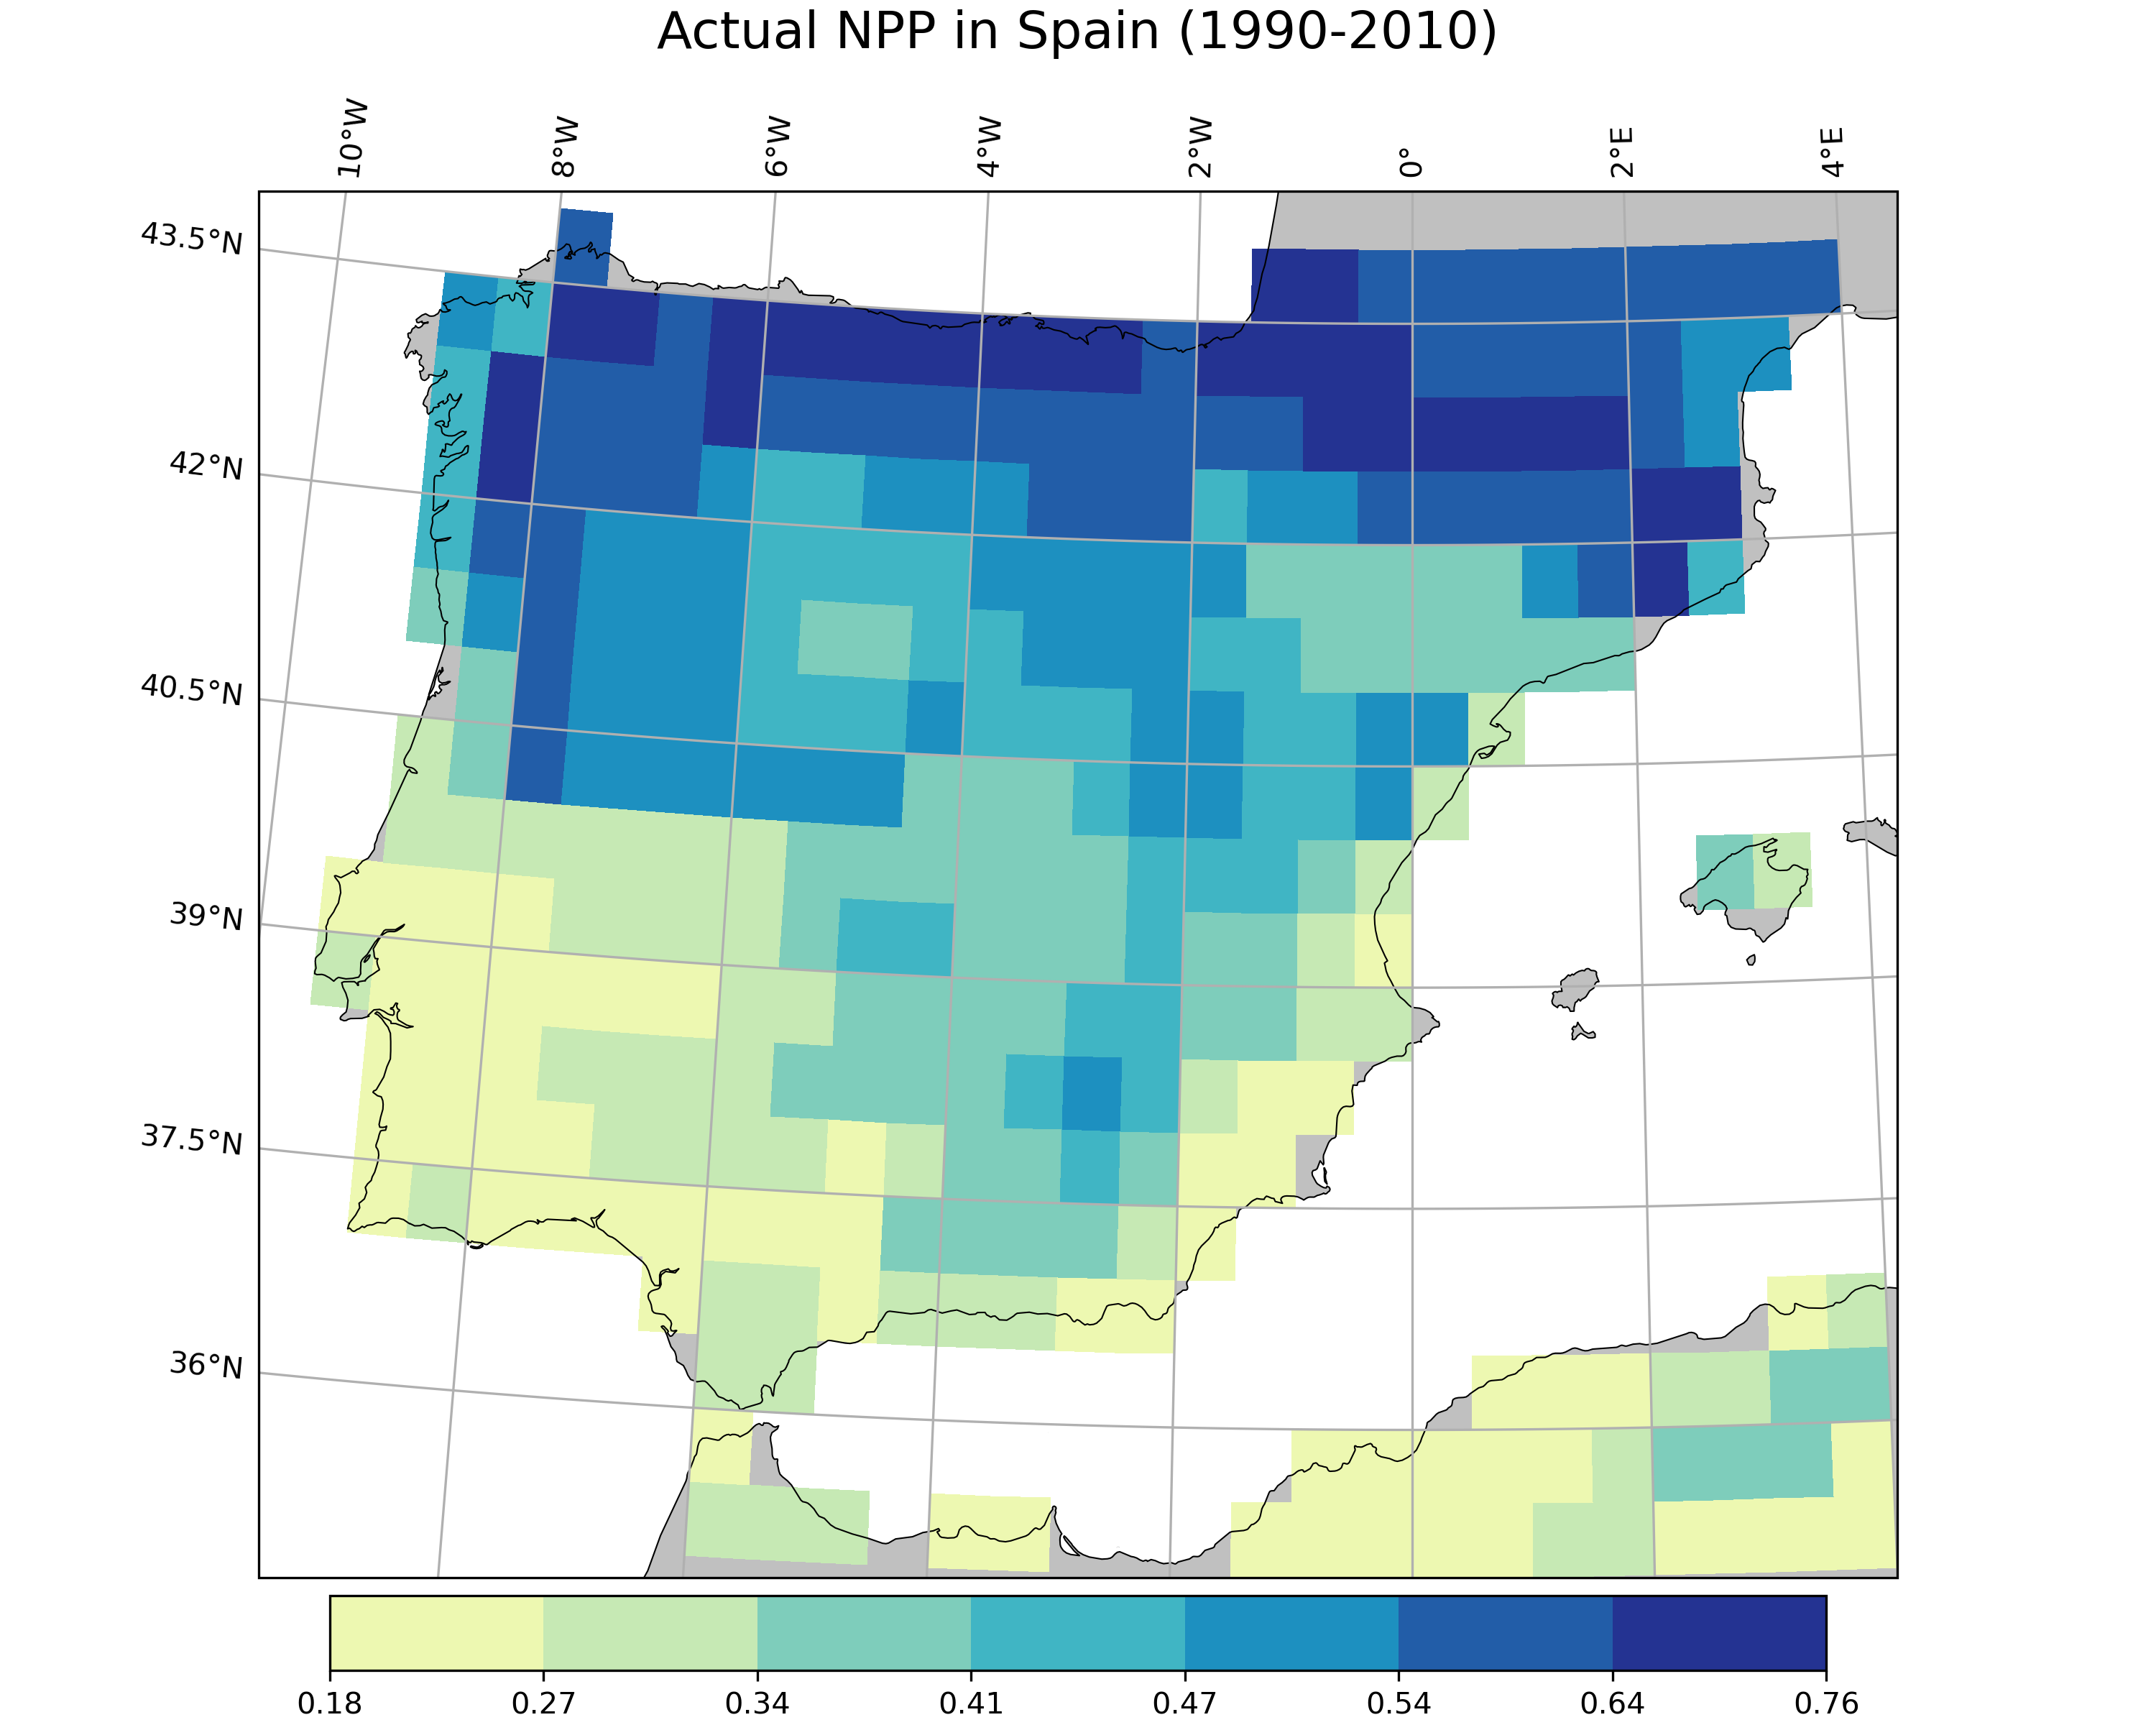
cv.make_simple_map(field=anpp,
layer="Total",
output_file="anpp_spain_map.png",
title="Actual NPP in Spain (1990-2010)",
n_classes=7,
classification="jenks",
palette="YlGnBu",
proj="TransverseMercator",
x_fig=10,
y_fig=8
)
JSON mode
In your terminal, use run_json():
python -c "import canopy as cp; cp.run_json('json_examples/simple_map.json')"
There are different examples available in the json_examples directory and on the canopy gallery website.
We recommend starting with one of these examples and modifying the arguments to customize the figure according to your needs.
Warning
The JSON mode does not support the full range of functionalities offered by canopy.
For example, JSON mode does not currently support the use of multiple time series or the specification of function keyword arguments (kwargs) as JSON keys.
You are restricted to the predefined set of arguments accepted by each visualization function (see Visualization for reference).
For more information about how to use JSON files with canopy, see the JSON documentation.